 en
en br
brLibrary
How to track slow SELECT statements in the production Firebird database
Firebird SQL has very suitable means to track slow SQL queries and other problems with performance through the mechanism called TraceAPI plugins. HQbird (advanced Firebird distribution for big databases) includes tool FBPerfMon, which implements TraceAPI and offers easy GUI interface to track all performance problems in Firebird.
In order to find the slowest SELECT SQL statements in the production Firebird databases use the following instruction:
- Request HQbird download information. (trial version will be sufficient for quick check-up). Download information will be sent by email.
- Download and install HQbird ServerSide on the server (Windows or Linux) and HQbird Admin on the computer with Windows. On Windows HQbird ServerSide installer will install the necessary Trace API plugin automatically (for Firebird 2.5 or 3.0, for 32 bit or 64 bit)), on Linux it will require manual copying to the Firebird/plugin folder. Remove standard plugin (fbtrace.dll/fbtrace.so) and restart Firebird to activate the new plugin.
- Start HQbird PerfMon Settings from Windows Start menu: IBSurgeon/HQbird Firebird Admin/FBPerfMon Settings.
- Select and add the database to be traced. Specify exactly the same connection string as you use in your applications. If you use alias – specify alias, the full connection string – specify the full path.
- Add trace session for the database
- Create log database (where to store trace results)
- Specify parameters to track (you can use default configuration initially and change it later, for example, enable SQL plan logging)
- Start trace session. After the successful start you will see the notification, and then all SQL queries and related information will be written to the log database. Remember that tracing captures data from all connections, so log could grow pretty fast.
- Wait some time (enough to capture problematic queries, usually 15-20 minutes) and then stop the trace session.
- Start HQbird PerfMon Viewer (from Windows Start menu) and select from the list the log database that was used for the recent trace session (or use "Open existing database").
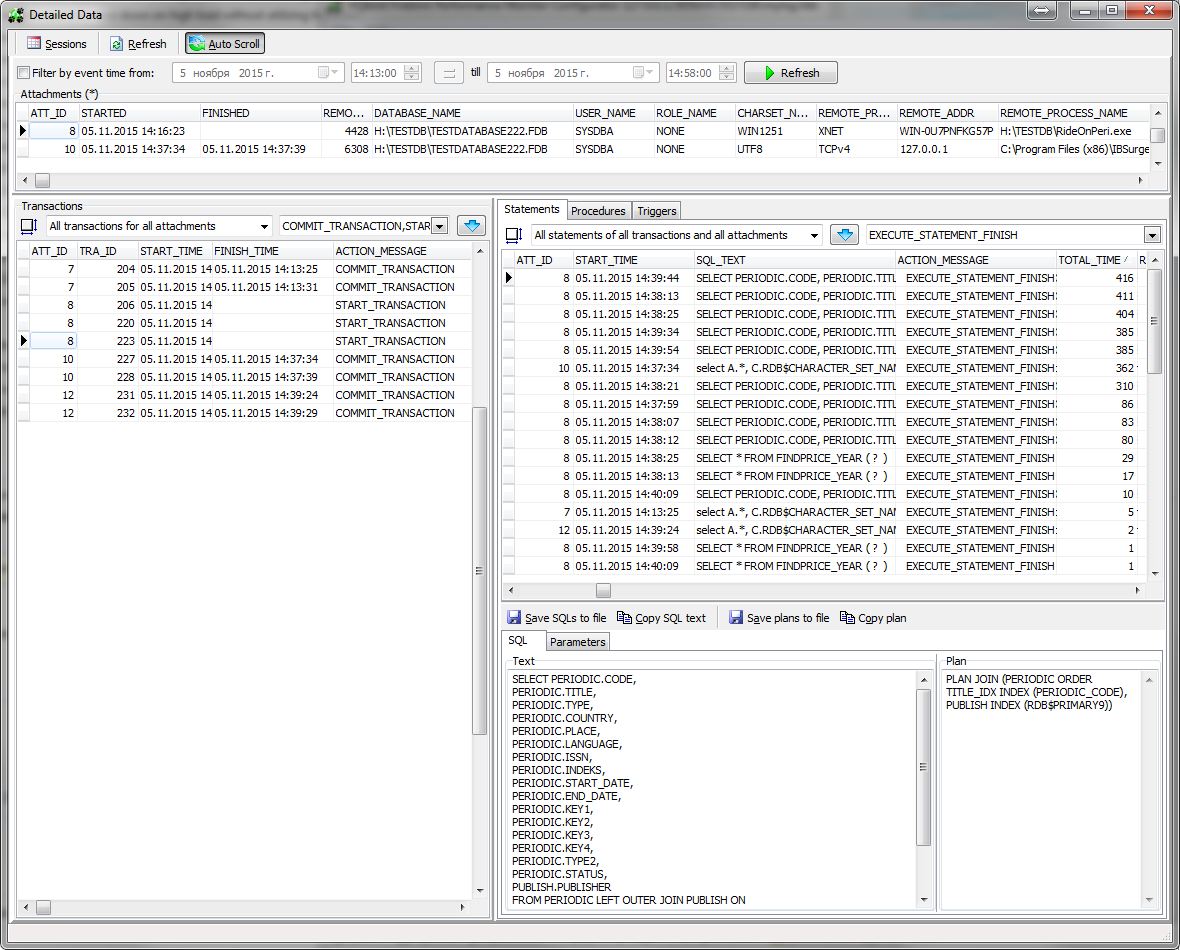
- HQbird PerfMon Viewer starts with the server load graphs, to see statements, click on «Details» and then on tab "Statements" sort all SQL queries by "Total Time".
- Copy texts of slow SQL queries with "Copy SQL text" button.
 For more details and detailed explanation, please refer to HQbird User Guide, section 4.3. Monitoring with Trace API: HQbird FBPerfMon, from page 64.