Monitoring in HQBird
FirebirdSQL Advanced Monitoring in HQbird
How to schedule Firebird performance monitoring in less than 1 minute?
Since In version 2018, HQBird has the automatic scheduled performance monitoring with Firebird MON$ tables and TraceAPI.It is possible to schedule the regular check of database performance for every HQBird (Standard, Professional, Enterprise) in less than 1 minute.
For this open tab Performance and set up monitoring for transactions and queries:

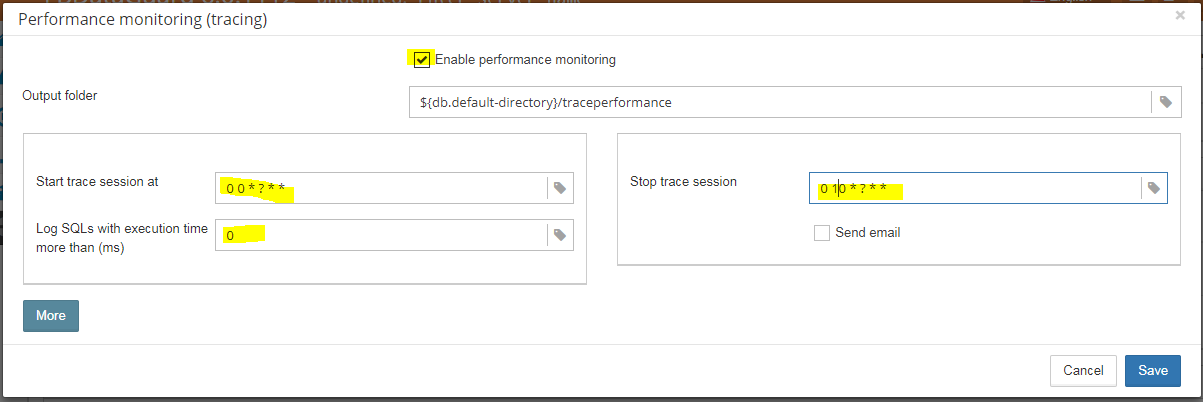
In order to setup Performance monitoring, specify its mandatory parameters in the dialog:

The first mandatory parameter is «Enable performance monitoring» - it must be enabled to run traces by schedule.
The next important parameters are «Start trace session at» and «Stop trace session». They contain CRON expressions which specify when tracing starts and stops.
By default, the trace is set to start at 10-30 and to end at 11-00. It is recommended to adopt a tracing schedule for your needs. Below you can see the table with some popular options.
| CRON expression for | Description | |
|---|---|---|
| Start | End | |
| 0 0 * ? * * | 0 10 * ? * * | Run trace every hour from 0 to 10 minutes |
| 0 0 8 ? * * | 0 0 17 ? * * | Run trace every day from 8-00 to 17-00 |
| 0 30 10,13,15 ? * * | 0 0 11,14,16 ? * * | Run trace sessions every day from 10-30 to 11-00, 13-30 to 14-00 and from 15-30 to 16-00 |
By default, the time is set to 1000 milliseconds or 1 second. It means, that only queries which take more than 1 seconds, will be logged and analyzed.
We recommend keeping 1000 ms as a basic value until your database is very slow: in this case, 3000-5000 ms can be a good start.
«Send email» checkmark indicates if there is a necessity to send the performance report. The email settings from Alerts configuration will be used to send performance report.
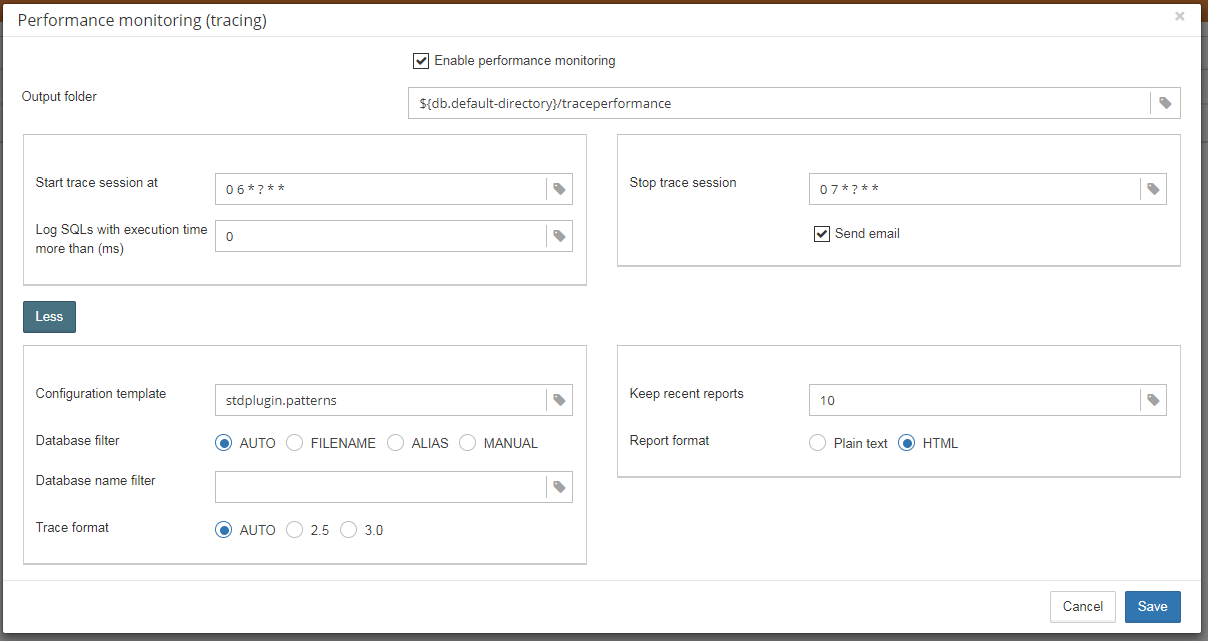
For more advanced settings, «Performance Monitoring» dialog has additional parameters (normally, you don't need to adjust them).

- «Configuration template» - the name of the configuration template file which should be used for trace settings
- «Database filter» - how the database should be identified. Usually AUTO is enough, it will trace the specified database. In the case of Filename or Alias, it will use filename or alias to filter database events. «Manual» provides an ability to set any regular expression, to trace several databases, for example, or more than one alias for the single database.
- «Database name filter» it is used in case of «MANUAL» selection.
- «Trace format» - AUTO means automatic selection, 2.5 or 3.0 will force format for 2.5 or 3.0. Usually, there is no need to change it.
- «Keep recent reports» - it specifies how many reports should be kept in the «Output folder» for possible retrospective usage.
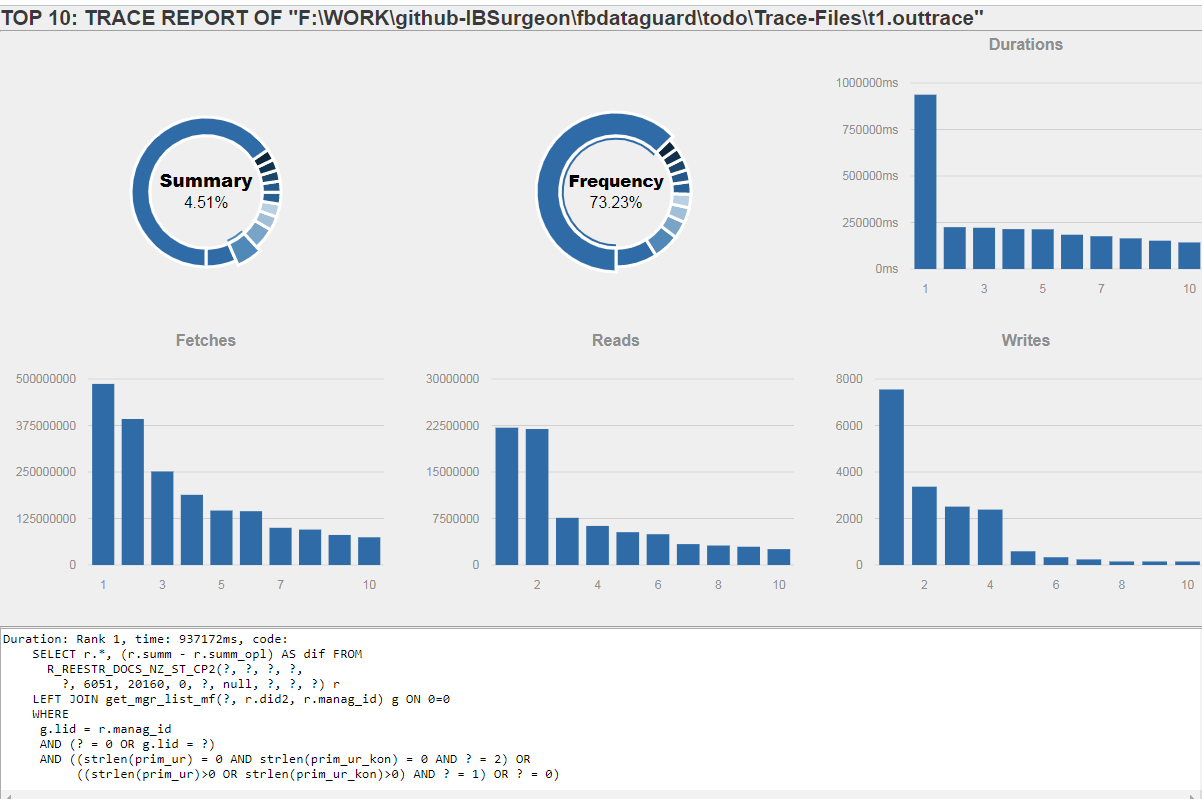
Also, the most recent performance is available for review and download in the HQBird interface:

What can we see in the performance report?
The HQbird FBDataGuard performance analysis provides 3 types of reports: list of queries sorted by their time, the most frequent queries, and queries, sorted by total execution time (summary).When you click «Sort by duration» (it is a default option), you will see SQL queries and stored procedures which took the longest time to execute first.
Normally there will be long-running reports and other big SQLs.
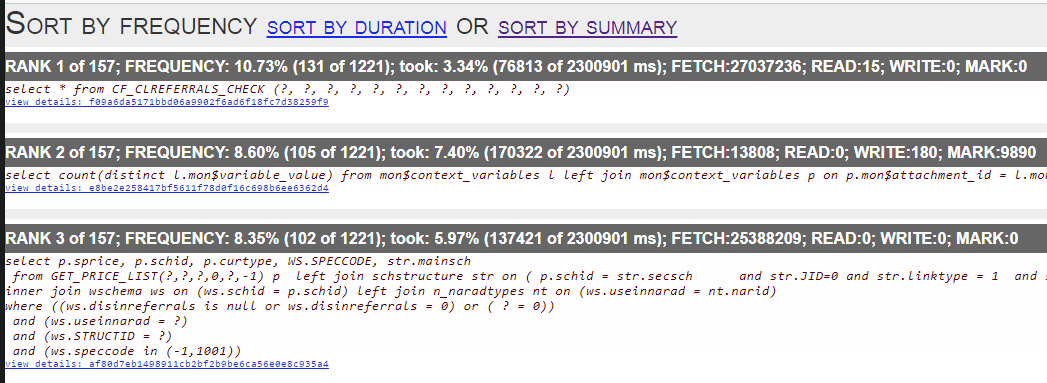
When you click on «Sort by frequency» link in the header of the report, you will see most frequent queries: i.e., those queries which started frequently and took the most part of the time (among logged queries).

For example, in this case, the statement CF_CLRRFERERRALS_CHECK was run 131 times and took 76 seconds from total 2300 seconds. It means that this query heavily affects the overall performance, and it should be optimized first.
To see details of the most frequent query, click in the link «View details» in the bottom of the query text:

As a result, you will see the longest query among the queries with the same SQL text, with its execution plan, execution statistics, and input parameters. This information is enough to analyze and optimize SQL query in Firebird SQL Studio or other developer IDE.

 en
en br
br