IBAnalyst
IBAnalyst is a part of HQbird Standard now!
IBAnalyst is a tool that allows a database administrator to analyze detailed Firebird or InterBase database statistics and then identify possible problems with database performance, maintenance and how an application interacts with the database.
Documentation
IBAnalyst graphically displays Firebird (or InterBase) database statistics in a user-friendly way and highlights the following problems:
- tables and BLOBs fragmentation,
- record versioning,
- garbage collection,
- indices effectiveness, etc
Moreover, IBAnalyst can automatically make intelligent suggestions about improving database performance and database maintenance.
IBAnalyst can get statistics from the live production databases through Services API (recommended), or analyze text output of gstat -a -r ... commands. Statistics from the peak load periods can give a lot of information about actual performance problems in production databases.
How IBAnalyst can help find problems in your Firebird or InterBase database
Let's walk through the key features of IBAnalyst. When you look at your database statistics in IBAnalyst first time, things can be not clear, especially if IBAnalyst shows lot of warnings by colored red and yellow cells at Summary, Tables and Index views. Let's consider several real statistics examples.
Summary View

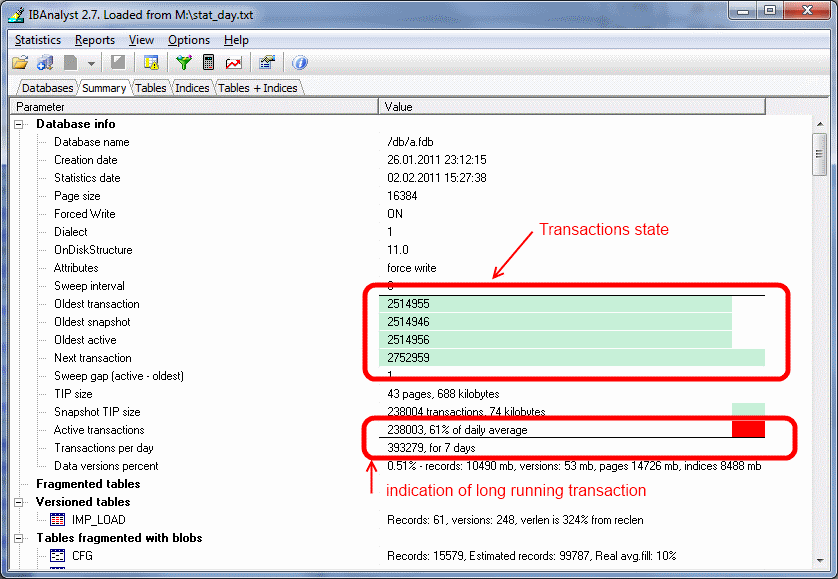
Summary page shows a lot of information, but the most valuable is transactions state (please read description of possible transactions states in IBAnalyst help, it is available by clicking F1 or in menu Help).
At this screenshot you can see that some transaction is active for a long time, "60% of daily average". IBAnalyst marks such transaction's state by red, because this transaction may prevent accumulated versions to be considered as garbage by server, and so, to be garbage collected. This is a possible reason of slowness: the more versions exist for some record, the more time it will takes to read it.
In order to find this long-running transaction you can use MON$Logger module of FBScanner, or perform direct query of MON$ tables. Then, to find out which tables were affected by long running transactions (tables with a lot of record versions) you need to go to "Tables" view of IBAnalyst.
Tables view

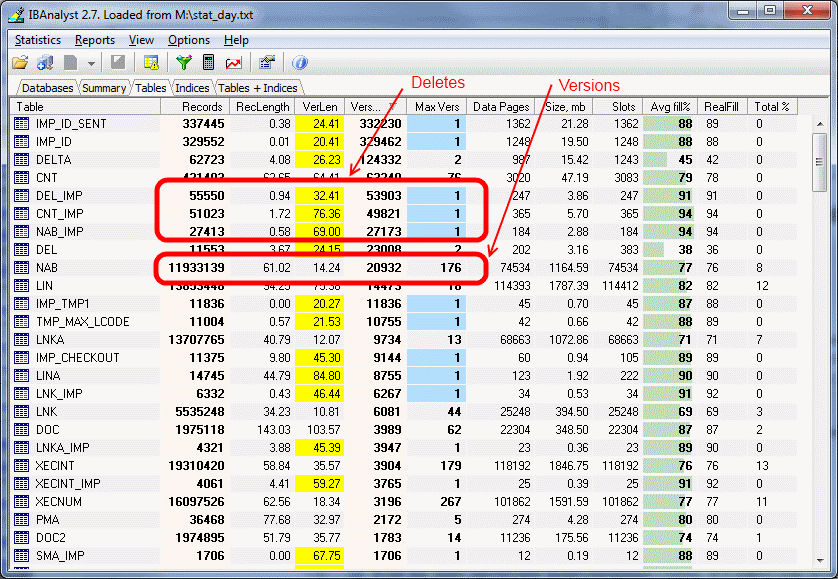
At "Tables" view you can see tables and their important parameters: number of records, number of record versions, record length, maximum number of versions, etc.
You can sort this view to find the largest tables. Especially we are interested tables with many record versions - many record versions will make garbage collection for affected tables longer. Usually it is necessary to change update and delete algorithms to get rid of many record versions.
Row Versions show total versions count for particular table, and row Max Vers shows maximum versions reached by some record. For example, if you look at table NAB, there are 11.9 million records, total versions are 20932, but one record have 176 versions. Reading and parsing such packet from disk takes more time, so, reading this record is slower than reading others.
This picture also shows a lot of tables where data was deleted. But, because of long running transaction, server can't delete these versions, and they still on disk, still indexed, and still being read by server when reading data.
Index view

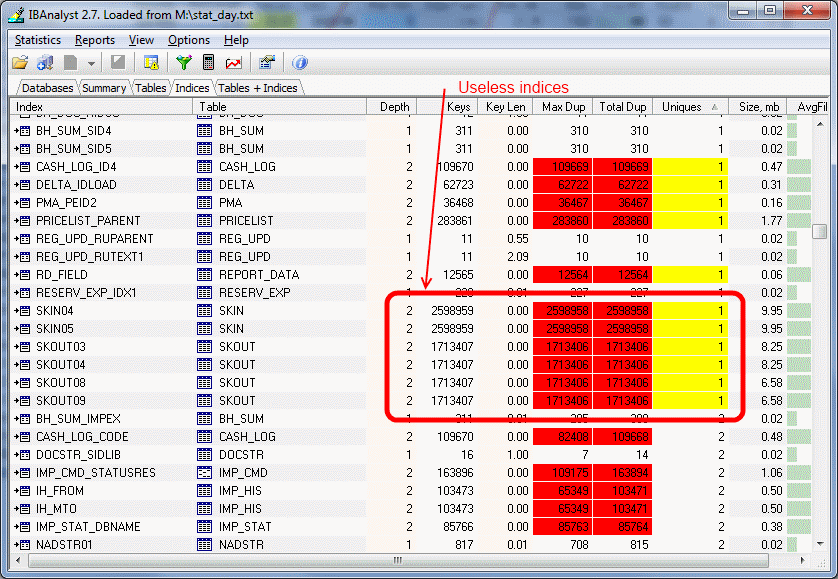
Some production databases can have indices with the only key value indexed. This can happen because database was developed "to be extended in the future", or, someone just experimented with the indices during development or tests. You can see these indices as "Useless" in IBAnalyst:
SKIN04, SKIN05, SKOUT03, etc, built on the column that have only one value for all rows (million rows). These indices are really useless, because
- optimizer may use this index if you specify "where field = ...". Since field contains only one value, using index will cause useless reading of index pages from disk to memory, and consume memory (and time) when server will prepare which rows to show for that query.
- creating indices is the part of restore process. Extra indices adds extra time.
Of course, that is not all that you can find about your database in IBAnalyst. You can also find
- average number of transactions per day
- was there rollbacks or lost connections, and when
- how big (in megabytes) each table and index
- tables that have records interchanged by blobs, and thus reading only records is slower
- empty tables - just forgotten, or empty at the time when statistics was taken
- indices with lot of duplicate keys (you can consider about column value distribution)
- indices with depth 4 and greater - maybe you need to increase page size to speed up
Automatic recommendations
If you confused by reading colored cell warnings, just open "Reports\View recommendations" - everything sufficient for database performance is gathered here. Please feel free to ask any questions (support@ib-aid.com)

 en
en br
br